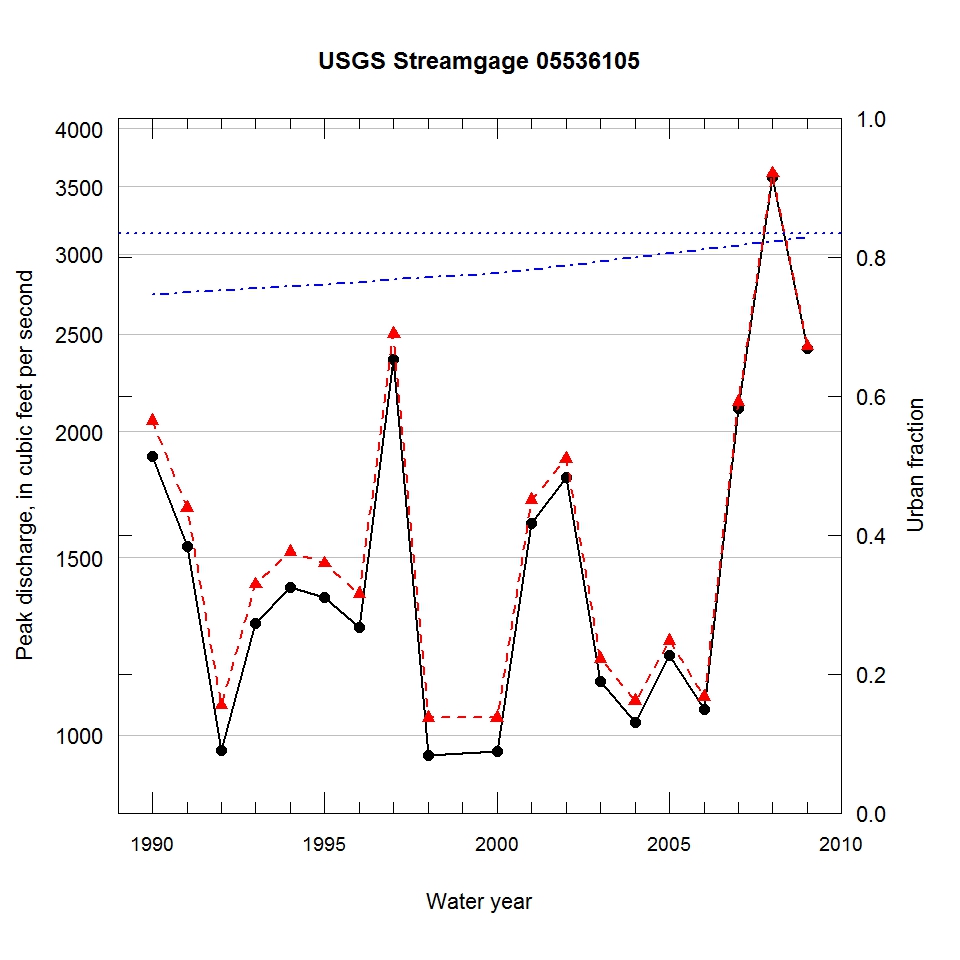
Observed and urbanization-adjusted annual maximum peak discharge and associated urban fraction and precipitation values at USGS streamgage:
05536105 NB CHICAGO RIVER AT ALBANY AVENUE AT CHICAGO, IL


| Water year | Segment | Discharge code | Cumulative reservoir storage (acre-feet) | Urban fraction | Precipitation (inches) | Observed peak discharge (ft3/s) | Adjusted peak discharge (ft3/s) | Exceedance probability |
| 1990 | 1 | -- | 3846 | 0.746 | 1.972 | 1890 | 2050 | 0.155 |
| 1991 | 1 | -- | 3846 | 0.749 | 2.304 | 1540 | 1680 | 0.280 |
| 1992 | 1 | CD | 4921 | 0.752 | 2.155 | 965 | 1070 | 0.715 |
| 1993 | 1 | C | 4921 | 0.755 | 1.085 | 1290 | 1410 | 0.461 |
| 1994 | 1 | C | 4921 | 0.758 | 0.629 | 1400 | 1520 | 0.386 |
| 1995 | 1 | CE | 4921 | 0.761 | 1.227 | 1370 | 1480 | 0.411 |
| 1996 | 1 | C | 4921 | 0.764 | 0.856 | 1280 | 1380 | 0.478 |
| 1997 | 1 | C | 4921 | 0.767 | 2.792 | 2360 | 2500 | 0.072 |
| 1998 | 1 | CE | 4921 | 0.770 | 1.164 | 954 | 1040 | 0.739 |
| 2000 | 1 | CE | 4921 | 0.776 | 1.072 | 963 | 1040 | 0.737 |
| 2001 | 1 | C | 4921 | 0.782 | 0.845 | 1620 | 1710 | 0.264 |
| 2002 | 1 | C | 4921 | 0.788 | 3.184 | 1800 | 1880 | 0.197 |
| 2003 | 1 | CE | 4921 | 0.793 | 1.386 | 1130 | 1190 | 0.621 |
| 2004 | 1 | CE | 4921 | 0.799 | 1.122 | 1030 | 1080 | 0.711 |
| 2005 | 1 | CE | 4921 | 0.805 | 0.697 | 1200 | 1240 | 0.578 |
| 2006 | 1 | C | 4921 | 0.811 | 0.765 | 1060 | 1090 | 0.702 |
| 2007 | 1 | C | 4921 | 0.817 | 1.553 | 2110 | 2140 | 0.135 |
| 2008 | 1 | C | 4921 | 0.823 | 4.296 | 3580 | 3610 | 0.019 |
| 2009 | 1 | C | 4921 | 0.829 | 2.213 | 2420 | 2430 | 0.081 |

